This chapter displays and explains the simulation results.
Contents
Figure 1 shows the results menu, which can be accessed via the |
|
button in the application menu. |

The menu is located on the left side. From there, you can navigate to the respective result categories.
The contents of this menu, as well as the statistics it contains, depend on the connected model.
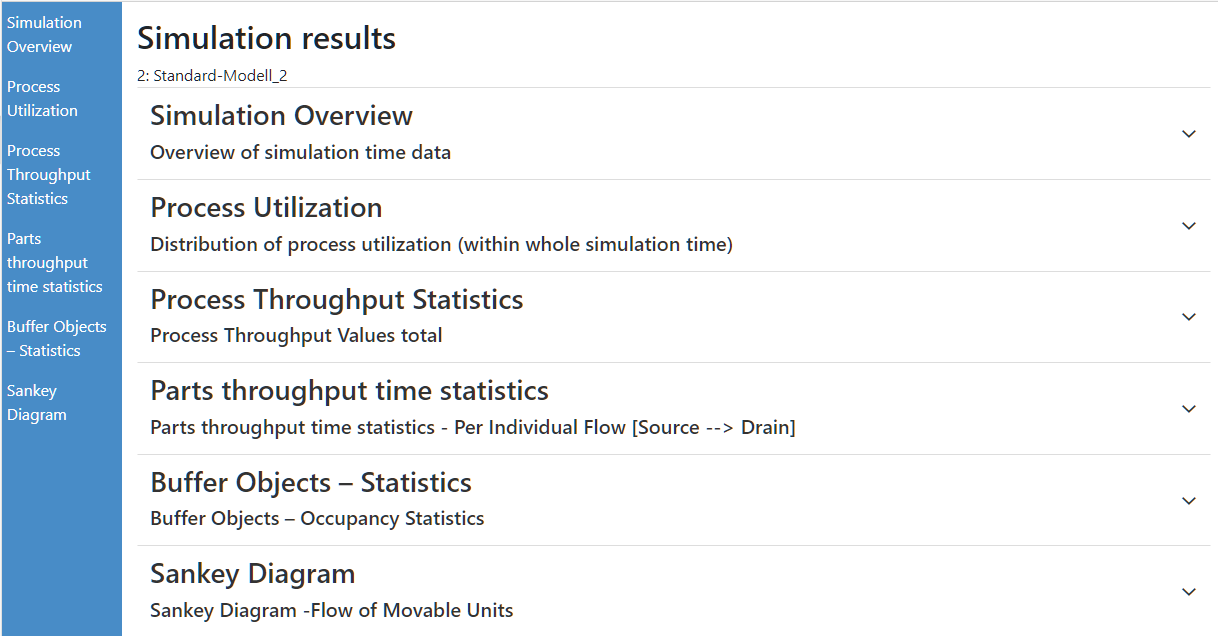
Figure 1 - Results Menu
To select an alternative, use the |
|
button |

Checking the box next to a model adds it to the results and identifies it by its title under the heading (Simulation Results).

Figure 2 - Alternative Selection
To compare alternatives, they must first be added to the simulation results as described in Section 1 of this chapter.
You can then expand the existing tree structure of the simulation results (see Figure 3) and compare the selected alternatives.
The display of the results depends on the order in which the models are listed in the upper part of the application.
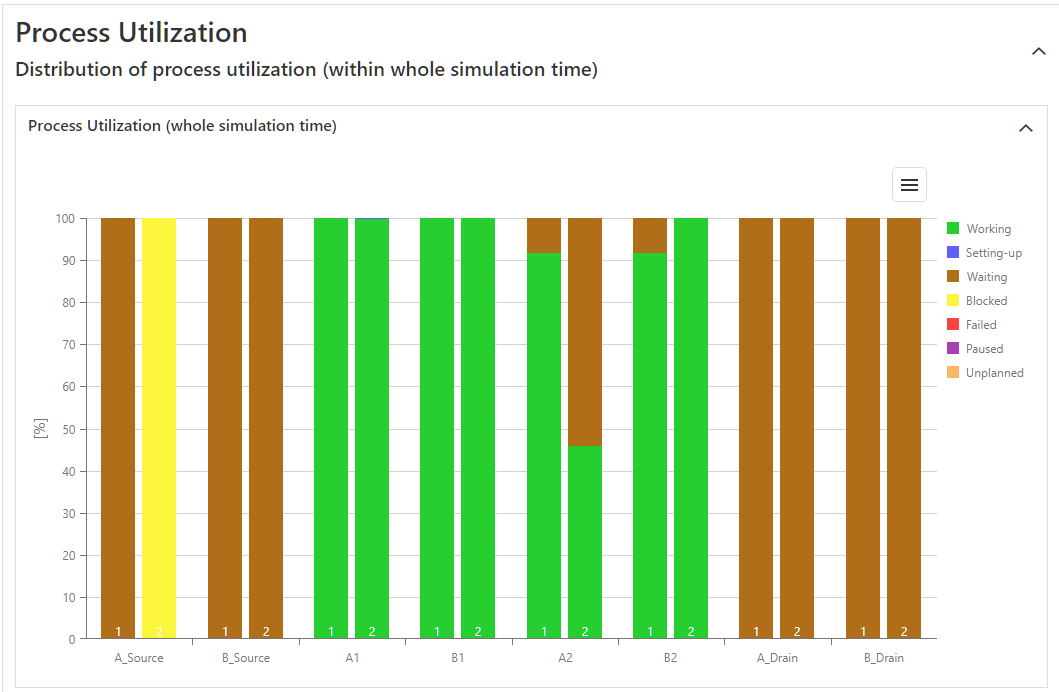
Figure 3 - Comparison of Alternatives
Where available, the results chart can be customized using the corresponding drop-down menus and filter fields.
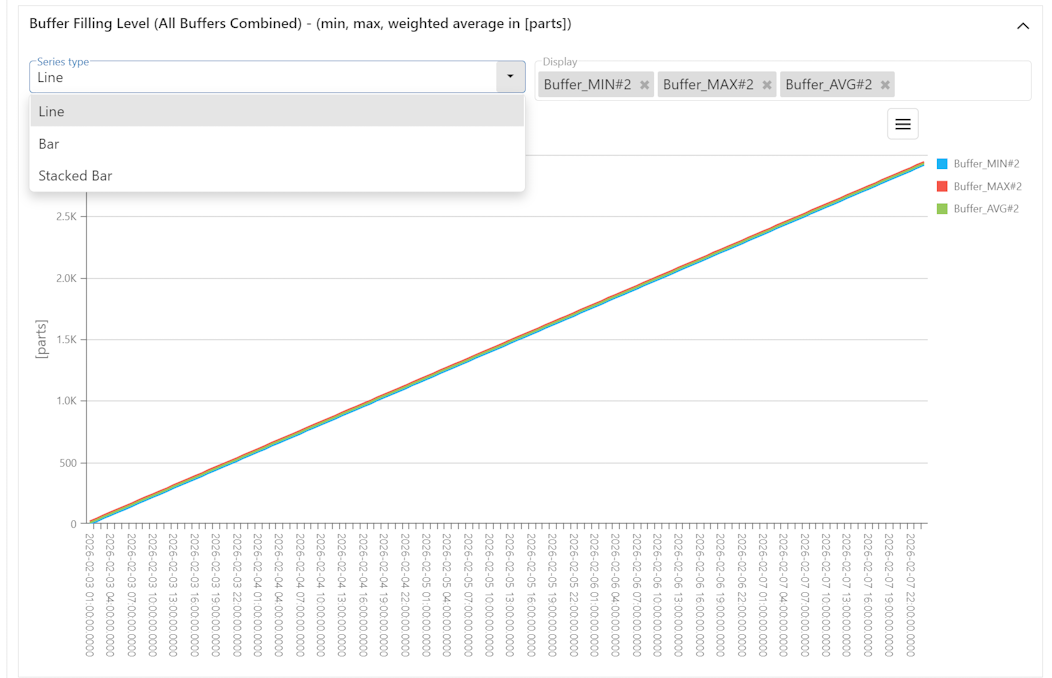
Figure 4 - Filter and chart types
© SimPlan AG - Hanau District Court, Commercial Register (Part B) 6845 - info@simplan.de - www.simplan.de/en